Toolmonitor Graphical Analysis
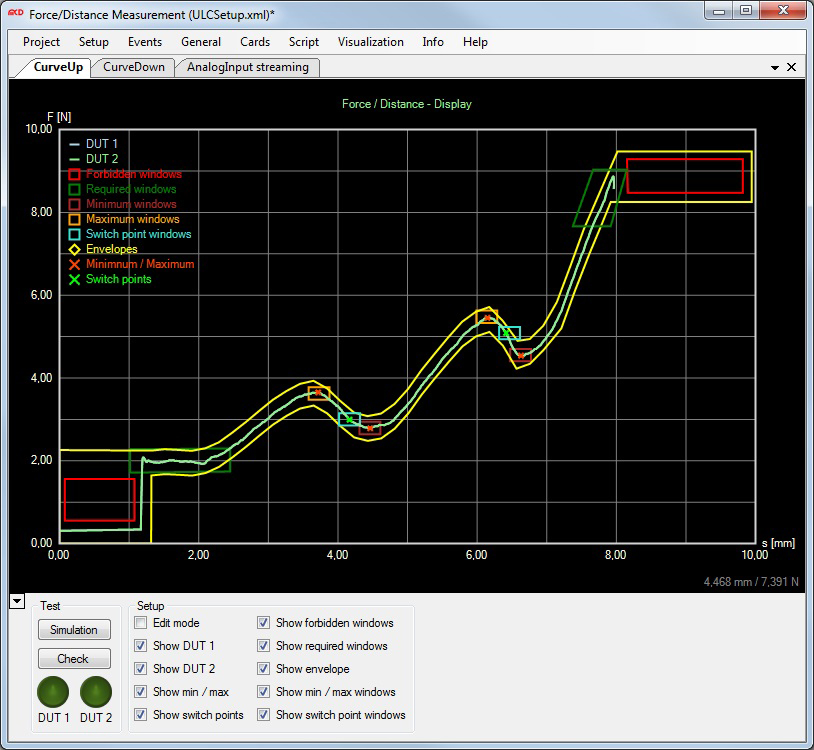
The Toolmonitor for the force-displacement measurement is a universal and flexible way to analyze force-displacement characteristic curves which are required for e.g. on the switch test.
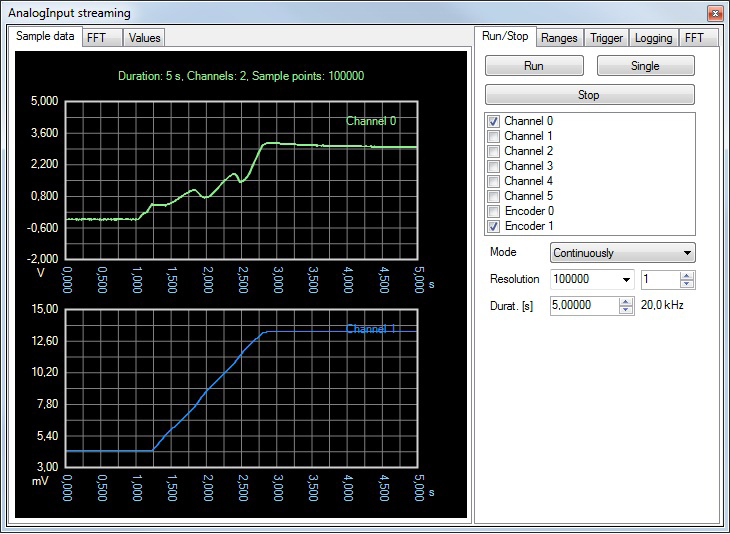
For the analysis, the path is recorded via an encoder, the torque or the pressing force is recorded via a force sensor and the switching points are recorded via the test item. These signals are displayed depending on their course and if required can be substantially analyzed. The position of the switching points is controlled and extreme values are determined. The components used, amongst others include filters, window functions and failure lines.
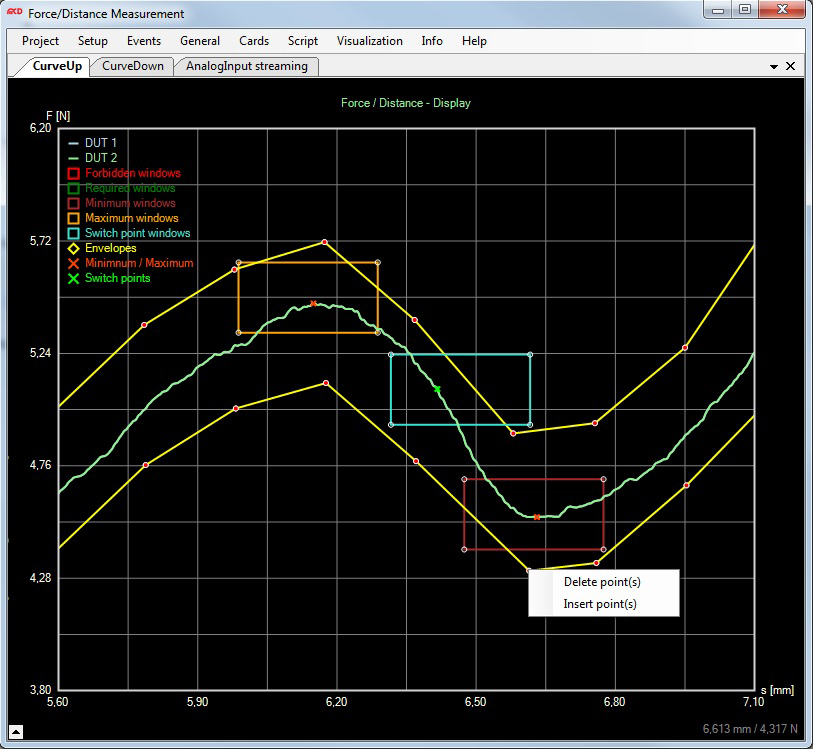
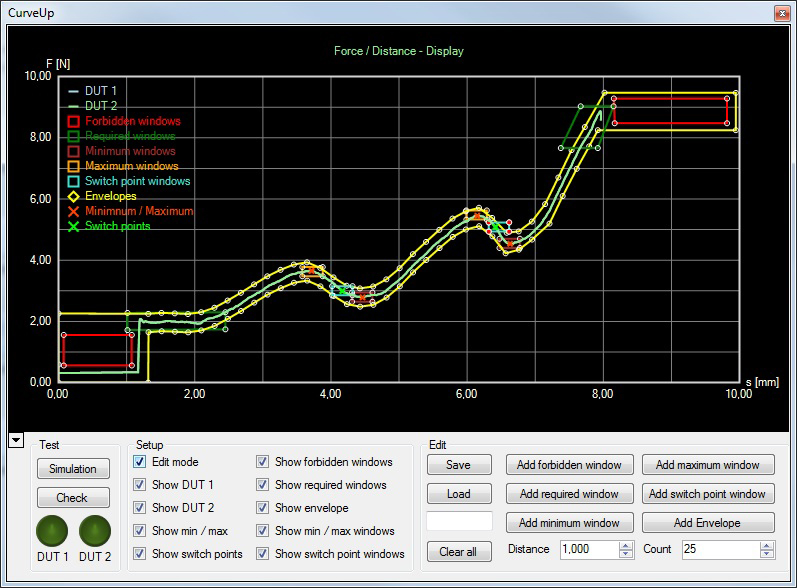
The required window areas and failure lines can be edited using a graphic designer. Any number of windows and failure lines can be defined. The failure lines can be generated automatically by means of the software from so-called „golden devices“ and can be edited later if necessary. The analysis of the recorded signals and measured values can be exported in various formats. All recorded signals and measured values can be exported in various formats.
The program interface can be freely designed and widely adapted to user requirements. Once the configurations have been created they can be stored in the project file and loaded when needed. Using an integrated script engine all measurements and settings can be automated.
For third-party software, the Toolmonitor can be fully remote controlled. COM/DCOM or .Net-Assembly is used as an interface. This allows the Toolmonitor Graphical Analysis to be integrated in a large number of applications (Microsoft Visual Studio® (C#, C++, Visual Basic), Microsoft Office® (e.g. Excel®), Open Office®, LabView®, MCD TestManager CE).
Order information
License fee for Toolmonitor Graphical Analysis
Order number: 121001

Further information about licensing can be found here.